2.1 Looking at physical aspects
2.1.1 Physical patterns
The physical phenomena of sound are prominent, for example, in works by Alvin Lucier. His perhaps most famous work, from 1969, I am sitting in a room... (Lucier, 1990), uses the medium of tape-recording to, in effect, sonify the physical properties of the space in which the piece is performed. In Lucier's The Queen of the South sound is directed to give rise to visible patterns on a surface in a way similar those ways associated with the works of Ernst Chladni (1787) and Hans Jenny.[n2.1]
[n2.1] Hans Jenny, 1967, Kymatik - Wellen und Schwingungen mit ihrer Struktur und Dynamik / Cymatics - The Structure and Dynamics of Waves and Vibrations
So called Chladni patterns, or figures, are shapes that are 'formed when a sand-covered surface is made to vibrate. The sand collects in the regions of least motion' (Stevenson and Lindberg, 2011). The surface patterns created by various modes of vibration are geometrical with numerous symmetries, and often similar in appearance to mandala formations. When using an oscillator to stimulate the plate with sinusoidal sound waves, higher frequencies yield more complex patterns than do lower frequencies, with the precise frequency required to produce a particular nodal pattern being dependant on the physical properties of the plate.
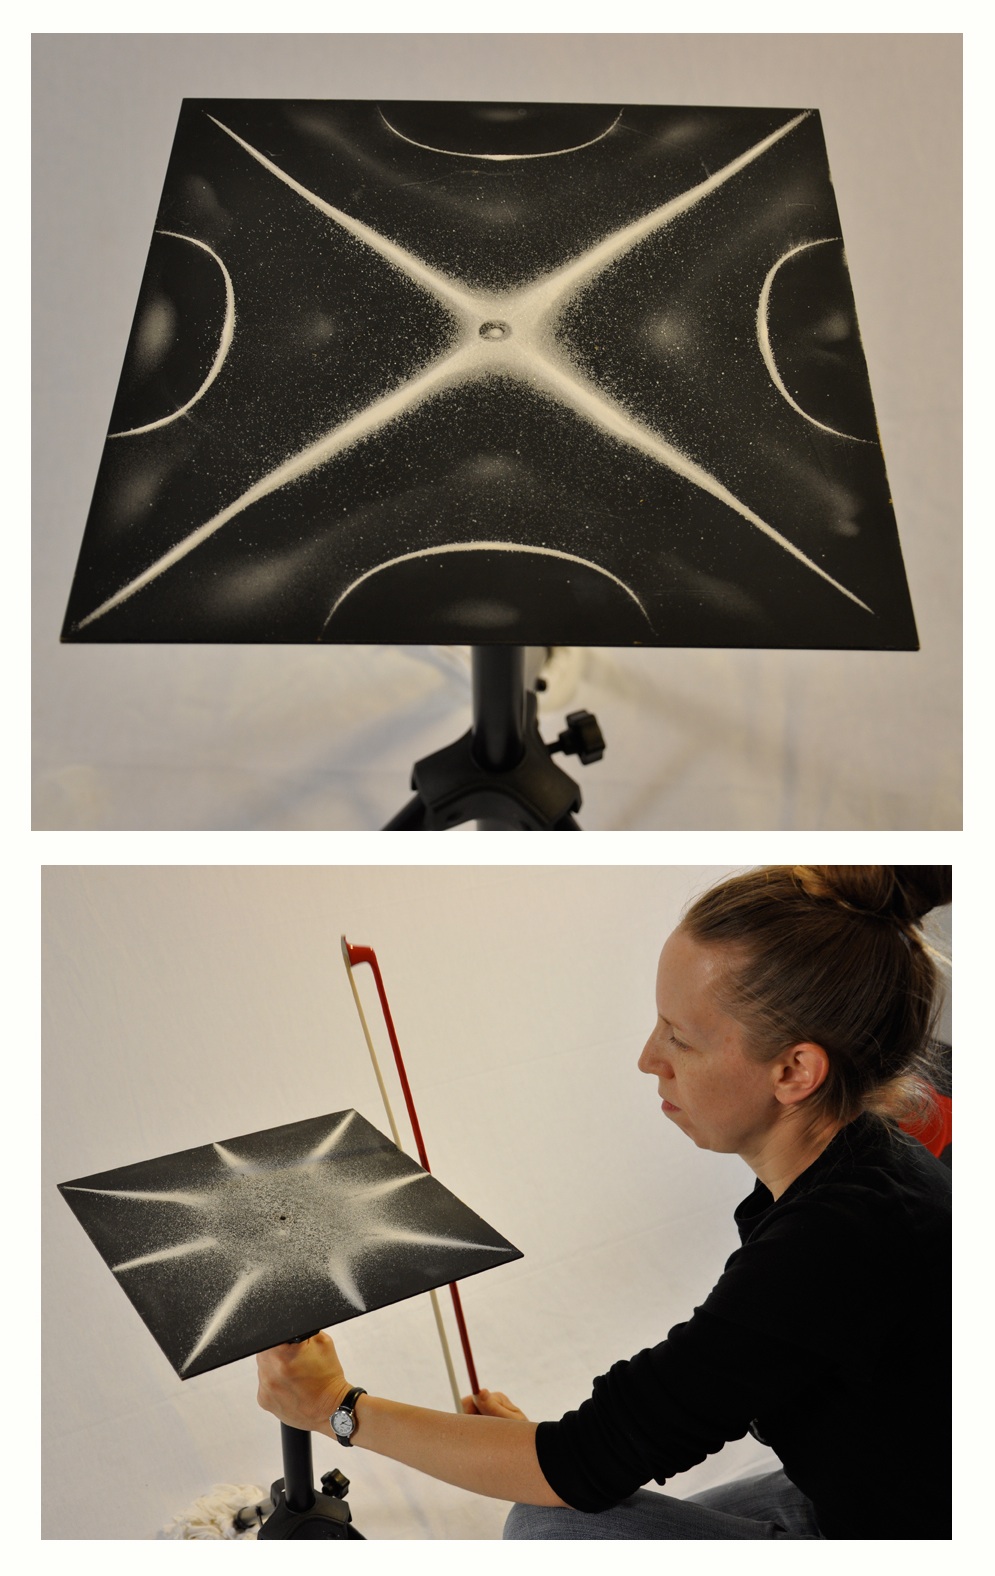
What Chladni was observing, in the late eighteenth-century, when the edge of a sand-covered metal plate was bowed and a visual manifestation of resonant sound waves was seen to take shape on the surface, was the same thing that Robert Hooke had seen in flour on glass a century before that; and we can today observe the same acoustic principles at play. Contemporary artist Jodina Meehan[n2.2] works with these principles, as illustrated in Figure 2.1 (Frank, 2010).[n2.3] The principles themselves are timeless and unchanging: a statement that, while it may seem obvious, is pertinent to the aesthetics of the project; they can manifest in different ways but the principles remain the same.
[n2.2] Editor of Journal of Cymatics: The Study of Sound Made Visible (http://cymatica.com/)
[n2.3] Other examples of contemporary practitioners working with Cymatic principles include Lewis Sykes (2011), and Meara O'Reilly whose Chladni Singing work (O?Reilly, 2010) reminds me of The Queen of the South.
With the title of Hans Jenny's 1967 book came the term Cymatics (translated from Kymatik) to mean the study of wave phenomena. Jenny invented the tonoscope so that the human voice may act as the stimulus to a surface on which sand is spread. Of an early performance of Lucier's The Queen of the South, March 1972, Tom Johnson describes (1989, p. 23):
[…] four singers sit around a square metal plate, about three feet across, with sand sprinkled on it. As they sing into their microphones, the metal plate vibrates, causing the sand to shift into many different patterns.
A year later from that, Johnson writes that the piece has grown in both duration and scope to include multiple surfaces that 'were stimulated by purely electronic sounds' (ibid, p. 42):
It may seem odd that a group of people would spend two hours watching minute particles vibrate and listening to the sounds that vibrate them, but there is an odd attraction to this symbolic activity, and most of the audience stayed until the very end. For me, the strongest association is with Navajo sand painting. But instead of a medicine man, the laws of physics are in charge of the mysterious rites. Lucier told me at the end of the evening that his own strongest association is with alchemy and that ?The Queen of the South? is an alchemical term.
He was attracted to the idea because of an appreciation for basic substances and for the mystery of how they interact with one another. Those with scientific backgrounds or with backgrounds in the visual arts would probably have made other associations.
The sounds were quite interesting in their own right, and it seemed like a rare opportunity to be able to watch these sounds as the many beautiful designs took form on the sheets. I felt I was getting a clue to the mysteries of the laws of the cosmos. What more can one ask of a work of art?
Cymatic patterns are visual manifestations of sound in particular conditions. Contemporary Cymatics often employ liquid surfaces and dramatic lighting to capture photographic images of the mesmerising shapes that transcend – from sonic to seeable – domains and stimulate imagination.[n2.4] These spatial manifestations are instantaneous representations of motion; they let us see something of the movement present at a given moment in time, revealing to the human eye dynamic processes of acoustic phenomena. Inspired by the sense of ever-present 'now' that these evanescent patterns portray has come the idea of reversing the process, of controlling visual aspects in the moment and letting sound be derived from the visual patterns being made.
[n2.4] See, for example, http://www.cymatics.org
2.1.2 The temporal trace
A more commonly encountered visual manifestation of the acoustic phenomenon is that which is drawn as a trace of sound pressure variations over time. This describes the typical 'waveform' representation of recorded sound, seen often in computer software. The concept of writing acoustic sound as a graph of amplitude variation along an axis of time is so common place in contemporary culture that one may overlook its impact on the way we conceive of sound as substance in the composition of music.
While the influence of sound recording technology on music in general is the subject of extensive research, this project is more specifically concerned with the visual aspect of recorded sound; the roots of which are found with the phonautograph, now described as 'the first instrument to record airborne sounds capable of being played back' (FirstSounds.ORG, n.d.). Patrick Feaster writes (2008, p. 3):
On 26 January 1857, ?douard-L?on Scott de Martinville of Paris deposited a seven-page handwritten document with the Acad?mie des Sciences. […] Entitled “Principes de Phonautographie,” this document is the earliest known account of the idea of using a membrane and stylus combination to inscribe atmospheric sound waves.
It was not within the remit of the invention for the phonautograph to be able to reproduce as sound the recordings that it made. Scott described his invention in relation to photography, which was itself a newly emerging technology in the mid nineteenth-century, and suggested that the traces made of sound – the phonautograms – be subject to visual inspection and study. The idea was of 'written sound' to be read by human eyes. It was only in 2008 that the FirstSounds initiative re-synthesised sounds recorded as far back as 1860 as digital sound-files (Hennessey and Giovannoni, 2008). By doing so, they have effectively rewritten the first chapter in the history of sound recording and playback.[n2.5]
[n2.5] Previously the phonograph – invented by Thomas Edison in 1877 – had been been viewed as the starting point in the history of sound recording; the phonograph was indeed the first machine able to replay as sound the representations of sound that were inscribed on cylinder surfaces.
Research by, and connected to, First Sounds has been ongoing during the period of this project. In November 2012, with his book Pictures of Sound: One Thousand Years of Educed Audio: 980–1980, Feaster applied and extended the new phonautogram reading techniques (Dust-to-Digital, 2012):
Over the past thousand years, countless images have been created to depict sound in forms that theoretically could be “played” just as though they were modern sound recordings. Now, for the first time in history, this compilation uses innovative digital techniques to convert historic ?pictures of sound? dating back as far as the Middle Ages directly into meaningful audio. […]
In short, this isn?t just another collection of historical audio?it redefines what “historical audio” is.
On a purely aesthetic level this reanimating and rewriting of history can be taken as an example proof of the reality-shifting potential of contemporary technologies. Of course it has always been the case that advancements in technology have brought fresh potential for creative expression and thus an expansion of perceived reality. Since the phonautograph, each newly invented recording medium has introduced new ways of working with recorded representations of sound, and so new possibilities for the composition of music.
2.1.3 Harmonic interactions
Another invention of the nineteenth-century that is related to the visualisation of sound as a physical phenomena is the harmonograph. Although grounded in the physics of motion, the harmonograph also connects to subjects that relate more to psychoacoustic aspects of sound, and so the discussion here does extend toward that of §2.2 below. In the context of the preceding discussions, the harmonograph may be thought of as a device for drawing temporal traces of Cymatic interactions, where that term is taken in the broad sense of studying wave phenomena; the wave-like motions in a harmonograph are provided by pendulums. The following description of the device is from Antony Ashton's book Harmonograph: a visual guide to the mathematics of music (2003, p. 17):
In the simplest version of the harmonograph two pendulums are suspended through holes in a table, swinging at right angles to one another. Projected above the table, the shaft of one pendulum carries a platform with a piece of paper clipped to it, while the shaft of the other pendulum carries an arm with a pen.
As the pendulums swing, the pen makes a drawing that is the result of their combined motion.
Showing a two pendulum harmonograph on the left, and a 'unison' trace drawn by a system of this type, Figure 2.2 comprises Fig. 1 and Plate V.(B) from Harmonic Vibrations and Vibration Figures (Newton, 1909) which Ashton acknowledges as the basis for his 2003 book.
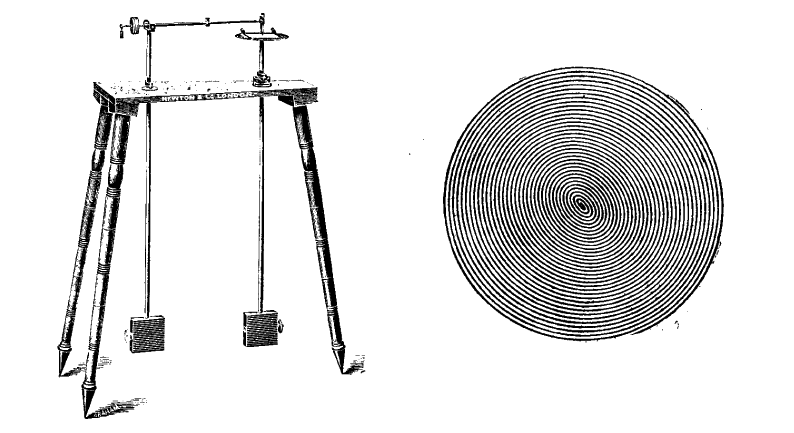
Figure 2.2: from (Newton, 1909)
Because a pendulum oscillates at a single frequency it is 'a perfect way to represent a musical tone, slowed down by a factor of about a thousand to the level of human visual perception' (Ashton, 2003, p. 16). Changing the position of weights along the length of the pendulum shafts will set how fast they swing.
The simplest harmonograph drawing is produced when both pendulums are the same length […]. With the pen held off the paper both pendulums are pulled back to their highest points. One is released, followed by the other when the first is at its midpoint. The pen is then lowered onto the paper to produce a circle developing into a single spiral. (Ibid., p. 20)
The spiral is formed in this situation by the decaying amplitude of the pendulum oscillations over time, while the initial circularity can be understood mathematically by the plotting of sine and cosine functions on the two dimensions of a cartesian plane: a reflection of the perpendicular pendulums set in motion with the aforementioned phase difference. If the phase relationship is shifted, by reducing the time waited before the second pendulum is released, then the circle becomes an oval and if they are 'released together the result will be a straight diagonal line across the paper' (ibid.). The traces become more interesting, however, when the lengths of the pendulums are not producing 'unison' frequencies of oscillation; distinct geometric patterns are drawn by the harmonograph when the ratio of the pendulum frequencies is corresponding to that of octave, fifth, or fourth intervals (ratios of 1:2, 2:3, or 3:4) or to that of an overtone (such as 1:3), and so on, whereas non-harmonic intervals yield less orderly patterns (harmonograms).
A source of pleasing variety in harmonograph drawings comes from small departures from perfect harmonies. This seems to involve a principle widespread in nature as well as in the work of many artists. There is a particular charm in the near miss.
An example from music suggests itself here. When two notes are sounded in near unison, the slight difference in their frequencies can often add richness or character to the sound. […]Eventually [a series of harmonograph drawings in which the length of one pendulum is gradually shortened] fades into a scribble that is a fair representation of discord […].
For most people this fading of visual harmony occurs at about the same point as the audible harmonies fade. (Ibid., p. 22)
Charles E. Benham, in Newton (1909, p. 37), is careful to point out that 'the analogy of eye and ear must not be pushed too far, and it is rather misleading to call the harmonograph figures ?music made visible,? as they have been styled sometimes'. Benham uses the ratio of 5:7 as an example of a harmony which is 'pleasing to the eye' but has 'no musical equivalent chord' (ibid, p.36). Whilst Benham suggests caution in connecting the principles demonstrated by the harmonograph to aspects of music itself, I find that the premise for that caution to be flawed. Although Benham's reasoning is rational, it seems – from a contemporary perspective – rather overstated: not least that the given examples of interval equivalence (see Figure 2.3) neglect the fact that equal temperament (ET) is not true to the harmonic proportions being described. The interval of a fifth in ET (an 'equal fifth') is measured as 700 cents:[n2.6] whereas – reading from the Intervals appendix of (Benson, 2007, p. 370) – the 3:2 interval ratio, which is the Just and Pythagorean (perfect) fifth, is measured as 701.955 cents.
[n2.6] “We now explain the system of cents, first introduced by Alexander Ellis around 1875, for measuring frequency ratios. This is the system most often employed in the modern literature. This is a logarithmic scale in which there are 1200 cents to the octave. […] on the modern equal tempered scale […] each semitone is 100 cents.” (Benson, 2007, p. 166)
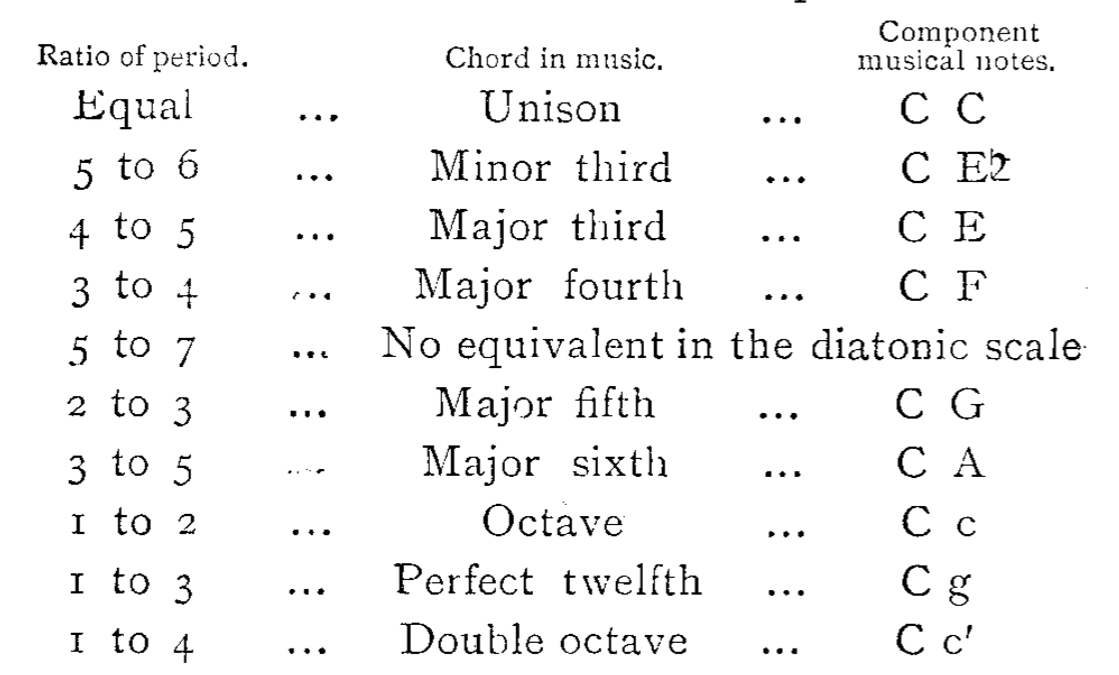
Figure 2.3: Benham's questionable table of harmonic intervals (Newton, 1909, p.36)
As with Chladni figures, the principles at play in the harmonograph are related to the physical nature of reality. Just as the compositional exploration of Cymatic practices in Lucier's Queen of the South is able to captivate the imagination of an audience, and suggest associations with 'the mysteries of the laws of the cosmos',[n2.7] so too may the harmonograph system have compositional value. In support of this notion, consider the following account from Ed Mattson. While it is more common for musicking to be encountered as having the affect of entrainment on a group of people – the synchronisation of human body moving to a musical pulse – Mattson describes a similar collective behaviour based on visual engagement with the harmonograph. Having designed and built a harmonograph, in Bourke (2008) Mattson writes:
[n2.7] as Johnson put it, see quoted in §2.1.1
I demonstrated the harmonograph at two of the annual shows put on by the Guild of Oregon Woodworkers but was not prepared for the response! It drew huge crowds and gasps of wonder as it did its magical thing. […] It was not just the drawing itself but the harmonious and mesmerising interaction of the parts of the machine that fascinated people as it swung away and drew the curves. The crowds were literally and unconsciously swaying in unison as they stood watching.