6.2 Alpha
The alpha build of sdfsys is described in this section, both to convey something of the techno-aesthetics of its design, and to provide a basis for understanding the more sophisticated beta version that follows (§6.3).
6.2.1 sdf.sys_alpha
The top level patch of sdf.sys_alpha, in the sdf.sys_alpha sub-folder of the _alpha portfolio directories, is sdf.sys_a51.maxpat. The inner workings of the system are documented by the files located in the sdf.sys_alpha_doc sub-folder (cf. Figure 6.1).
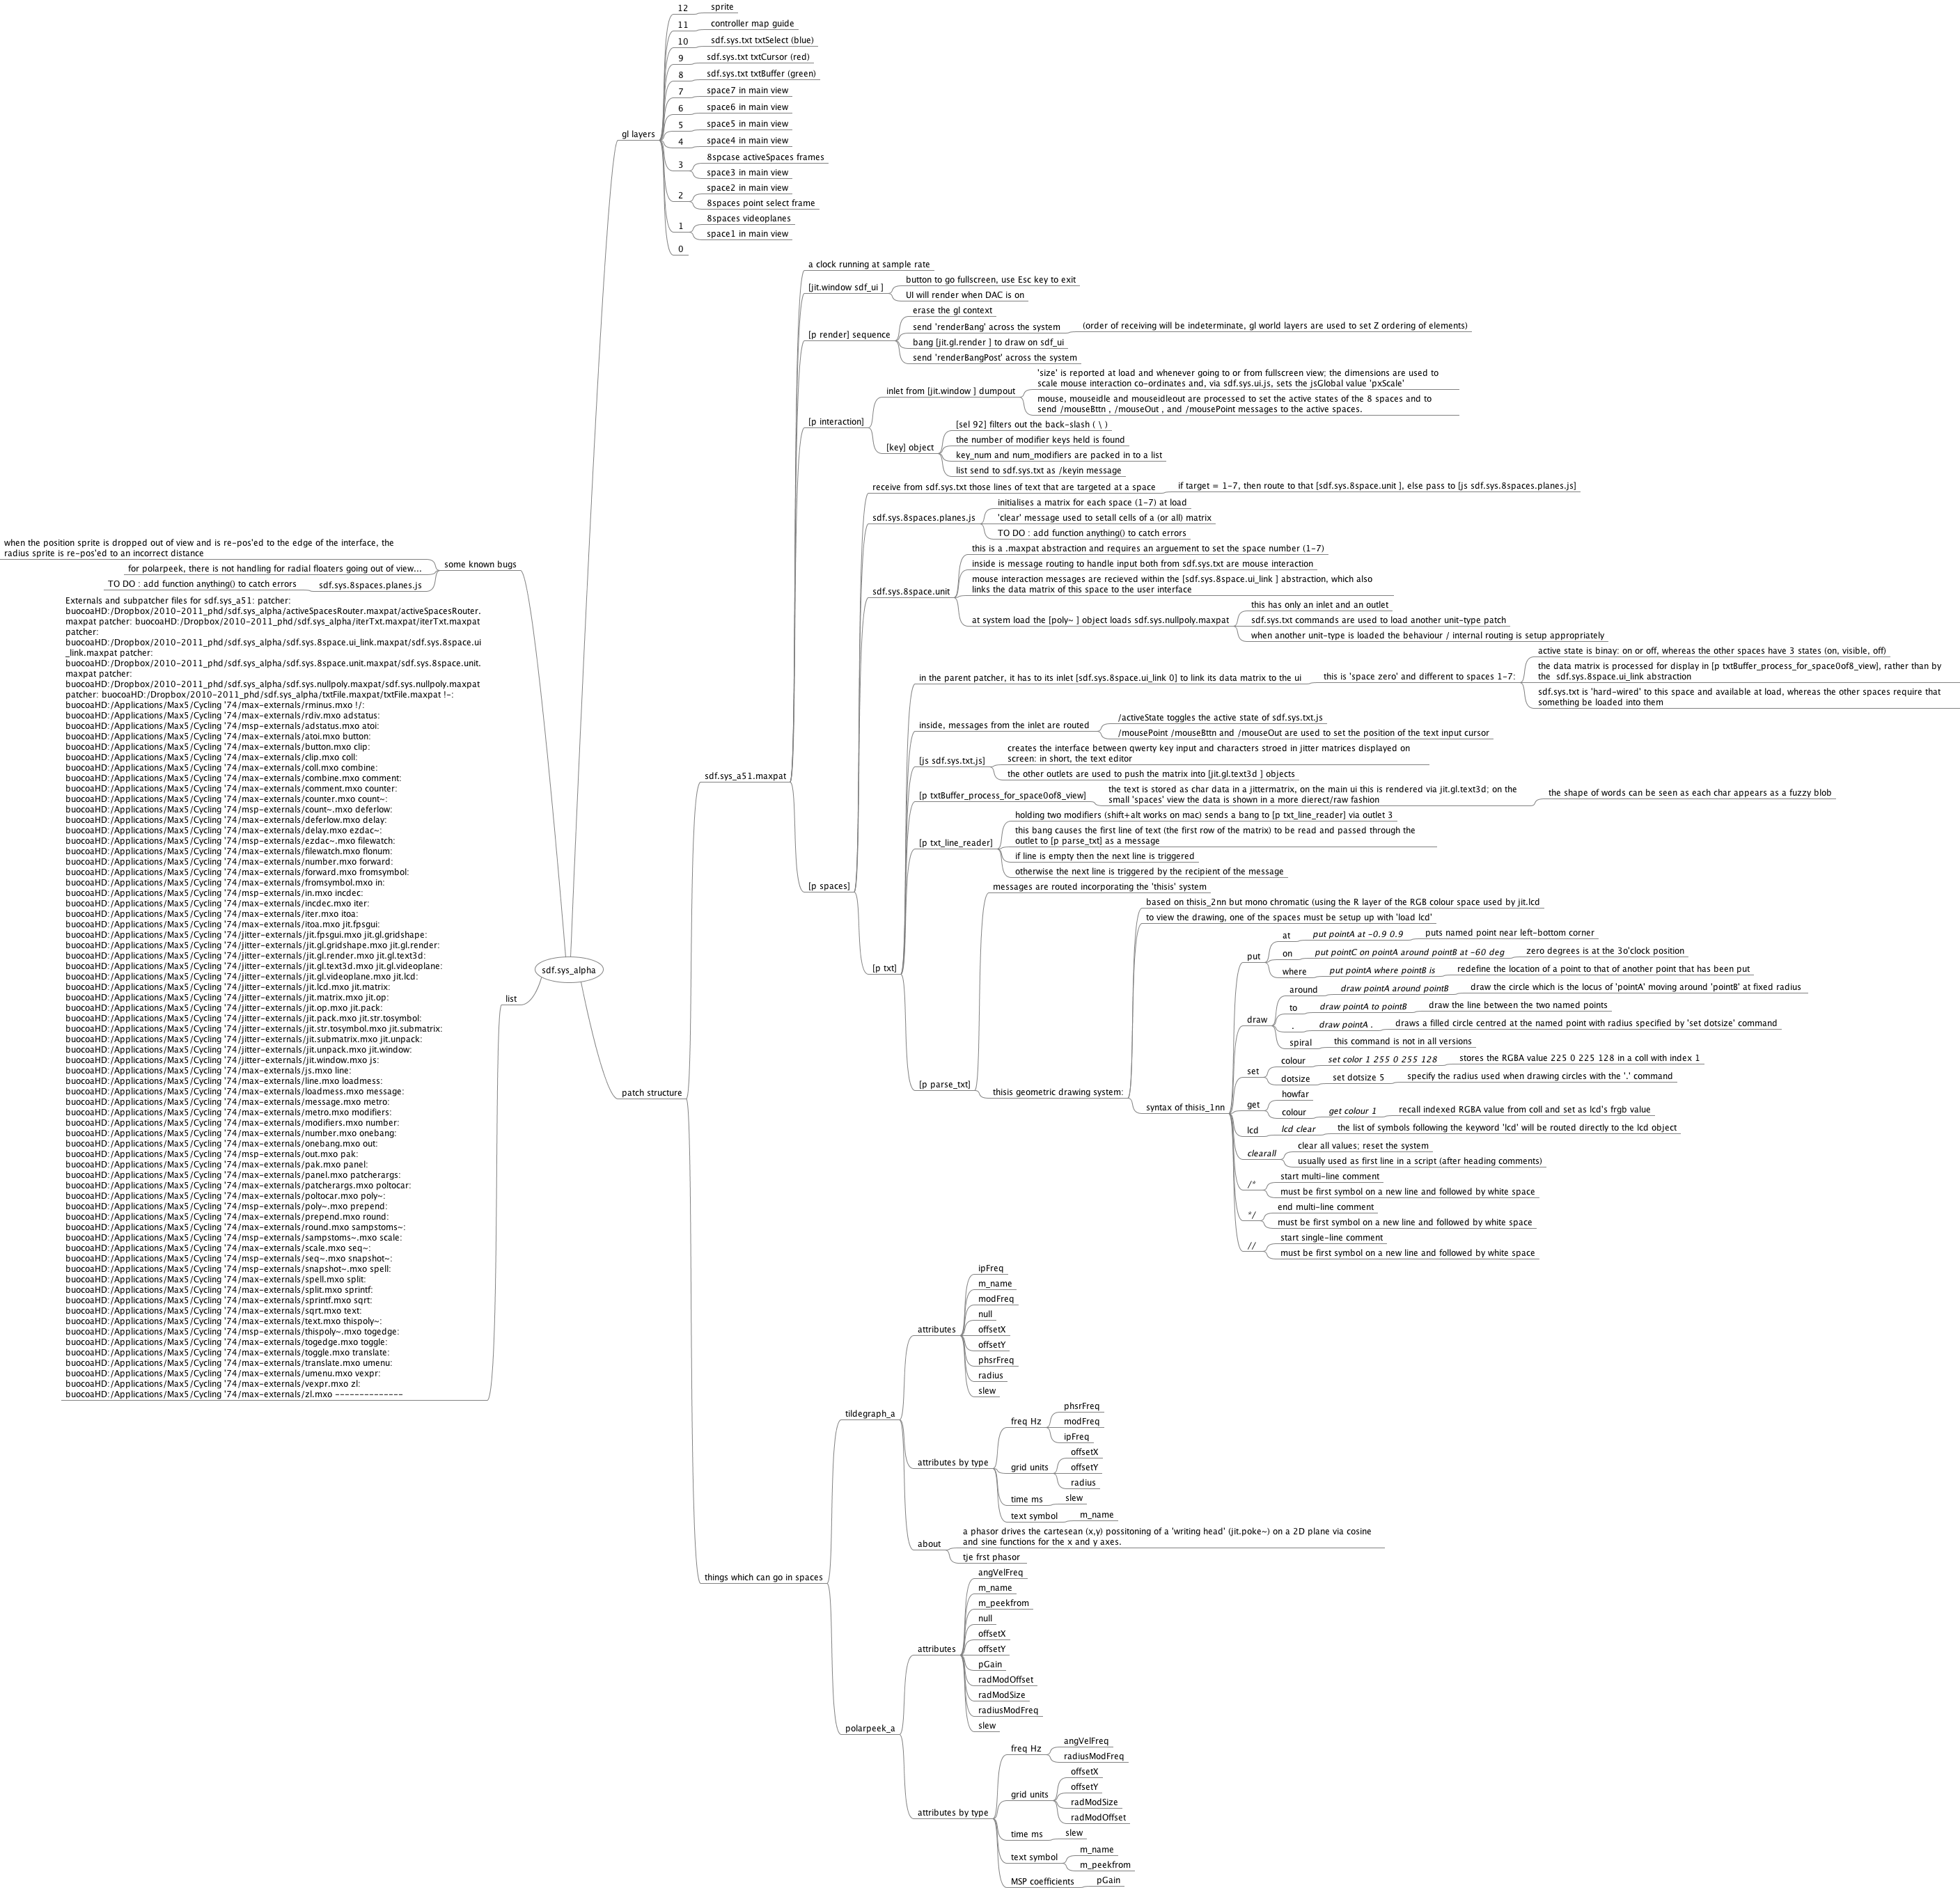
Figure 6.1: sdf.sys_alpha_mm
6.2.2 Motivating factors for sdf.sys_alpha
Of the aims motivating the alpha build, there are two objectives which stand out: (one) the primary goal of sdf.sys_alpha was to establish the basis of an environment with which to then complete this project, and (two) after my proposal for a live coded video example of this system[n6.2] was accepted for publication on a Computer Music Journal (CMJ) DVD, its construction was imperative. The curators of that CMJ DVD (Thor Magnusson, Alex McLean, and Nick Collins) allocated two minutes for my video contribution which, thus, was titled sdfsys2min (Freeman, 2011).
[n6.2] Which was quite hypothetical at the time of writing the proposal.
The timeframe imposed on the alpha build by the deadline for the CMJ DVD gave a particular incentive: the possible complexity of the alpha build was limited by the available time. Some of the technical requirements of the contribution for publication were also allowed to influence design of the system.
6.2.3 The gl-ui
To implement sdf.sys_alpha, the first step was to establish the basis for its visual representation.
(6.2.3.a) Decisions in the gl-ui design
It had become clear – not least after the experience of creating CirSeq_Zero, and inspired by some of Oli Larkin's work c.2009–2010[n6.3] – that the best option, for the construction of a custom GUI to a new system being programmed in MaxMSP was to use the jit.gl family of objects from Jitter.
[n6.3] http://www.olilarkin.co.uk/
My first experiments with the jit.gl objects had occurred at the time of first developing what became thisis; §5.1 described how existing software systems for programmatically drawing to the computer screen, although powerful beyond my requirements, did not seem to offer the compositional workflow that I did require. It was also described that a coordinate system like that of OpenGL (whit a centrally located cartesian origin) was then taken within the specification of thisis. It is now recognised that there multiple workflows within the process of composition. Roughly speaking these can be divided into the categories of preparation and performance, but by performance here I refer to performative aspects within the act of composition, rather than to the performance of an already composed work; of course thos e two types of performance may coexist, as in improvisation. See §6.5.1 for a more thorough discussion and contextualisation of the different cognitive modes of working with computer music software.
In the preparation of the sdfsys environment, toward performative composition of new computer music, processes that lay outside the realm of the ideal workflow of the performance domain are embraced. Programming in MaxMSP is now, for me, outside the realm of the ideal workflow for composing new computer music, but remains, nonetheless, the software environment within which I can create most proficiently. Because sdfsys is created in MaxMSP with the use of Jitter and JavaScript techniques, it is undoubtedly influenced by an associated technê. It is, however, the intention of this commentary to describe sdfsys in such a way as to make its important features cognitively unbound from the actual implementation, such that future versions of sdfsys (or sdfsys like systems) could be programmed in different environments.
Knowing that the interim goal of the system was to demonstrate how its key components interrelate via video recording, the front end of the software was conceived with the target medium of the CMJ DVD in mind. It had been requested that the video format of the submitted .mov file be NTSC, which is a 'US-originated transmission standard for analogue colour television' (Chandler and Munday, 2011), and has a resolution significantly smaller than contemporary computer screens. Many of my previous works were either fitted to the screen of my own laptop at the time of making,[n6.4] or were made to adapt to the size of the hosting screen (as in g005g). For sdfsys it was decided that the native size would be accepted as small; by rendering the interface with the jit.gl objects, the destination display can easily be resized, making it almost a moot point. The point here, however, is that the aspect ratio of the interface should be preserved when resizing.[n6.5]
[n6.4] Admittedly, this practice is rather egocentric and is future proof in of itself only if the trend of each new laptop having equal or greater screen size resolution is maintained.
[n6.5] It is not strictly necessary for that to be the case, but it is the way that I chose to think of the design.
At this point there is introduced a certain degree of irony caused by the differing technologies of the computer screen medium and analogue television broadcast standards for which DVD video is designed. When the resolution of the NTSC standard is described as being 720 by 480 – such as in the Final Cut Pro 7 User Manual (Apple, n.d.) – it is because the pixels of that system are not square: their height is greater than their width. The aspect ratio of NTSC is defined as 4:3, but the aspect ratio of 720 to 480 is 3:2.
Bringing back to mind those aspects of sound that were looked at in chapter 2, one may recall that harmonic ratios are cited as important to my musical language, and also that certain features of human perception of pitch have been given attention in this project. Ratios are used both to describe the two dimensions of a screen and the two frequencies of an interval. If one tilts one's head to the side then 4:3 and 3:2 are as 2:3 and 3:4, which in auditory terms are the intervals of a fifth and fourth (§2.1.3). If the choice is thus to choose between a fifth or a fourth to stand as an ever-present visual aspect of the compositional system that I am building, then it is the smaller-numbered ratio of the fifth that I choose. Shepard has already been cited (§2.2.2) as reporting ethnomusicological studies to 'have found that octaves and perfect fifths seem to be culturally universal'; the spiroid-frequency-space (one of the mappings that is used for parameter sprites in sdfsys) is based on octaves, and so it is fitting for the fifth to manifest in the framing of the space to be mapped. The native resolution of sdfsys is thus 720 by 480 measured in square pixels on screen, and a jit.window object, named 'sdf_ui', is created with those dimensions.
(6.2.3.b) Divisions within the gl-ui
The gl-ui for the alpha build of sdfsys is divided into two parts: on the left is the main area, and to the right of that is the sidebar. The main area occupies the largest possible square within the window, and is where the visual layering of data-matrices, text and parameter sprites takes place. The sidebar is sub-divided into eight framed squares. Each frame represents one of the eight spaces, and miniature views of the data-matrices belonging to the eight spaces are displayed within those frames.
Figure 6.2 shows the outline of the layout, but the lines shown here are not rendered on the gl-ui in sdf.sys_alpha; instead, when the mouse point is within the side area, the frame of the space represented by the square under the pointer is highlighted. The following section (§6.2.4) describes the interaction with these frames and all other aspects of the gl-ui.
Numbering of the eight spaces starts at zero at the top-left of the two columns in the sidebar; space one is below space zero, space four is to the right of space zero, and space seven is represented by the framed square in the bottom-right corner of the gl-ui.

Figure 6.2: sdf.sys_alpha ui layout
6.2.4 Interacting with sdf.sys_alpha
(6.2.4.a) Rendering the gl-ui and remapping the mouse position values
In sdf.sys_alpha, the connection between the visual and the audible is emphasised by linking the rendering of the gl-ui to the DSP state: one cannot interact with the sdfsys environment unless the DSP in MaxMSP is switched on. When DSP is on, the gl-ui is rendered and interaction can be mediated by mouse and qwerty input.
When sdf.sys_alpha is loaded, the gl-ui is seen at its native size in a window below the top level patch. The button in the top right corner of the patch can be clicked to enter the 'fullscreen' view of gl-ui, and then the [esc] key can then be used to exit. Fullscreen viewing of the gl-ui requires that the aspect ratio of the hosting screen be of a 'widescreen' format because, when the hight of the gl-ui is maximised, on a 4:3 display, the left and right edges of the gl-ui would be rendered off the sides of the screen. Typically, fullscreen viewing of the gl-ui will include some null space to the left and right because 'widescreen' is rather wider than the 3:2 ratio used by sdfsys.
When the gl-ui is fullscreen, the mouse position is still reported by the jit.window object in terms of screen pixel coordinate values. I found that the 'screen-to-world' type translation built into the jit.render object did not give me the numbers that I would expect for mapping the actual screen pixel position to a point within the gl-ui.[n6.6] To remedy this, I implemented an alternative solution for mapping the mouse position values to allow sdfsys to 'know' where the mouse is relative to its own gl-ui. A positive byproduct of this custom subroutine is that it generates a 'pixel scale' value that is then shared as a global variable via JavaScript for use in other parts of the system.
[n6.6] I have prior experience working with the jsui object and the 'screen-to-world' type method therein, which may have clouded by expectation of the jit.gl.render behaviour which was found not to be as expected. As is often my style, I simply chose to fix the problem, rather than worry about it.
(6.2.4.b) Frames in the sidebar
The 'active state' of all eight spaces is set by default to the value 0, which is represented visually by the absence of the frame around that space in the sidebar. The active state of a space can be changed by clicking, or [shift]+clicking, within its frame in the sidebar grid. There are three possible active states; a normal mouse click will toggle between states 1 and 2, and [shift]+click will set the active state of the represented space to 0:
[n6.7] The term 'Off' was originally used here, but may be misleading because the DSP processing of that space (if there is a module loaded) is always 'On' (as it were), and the data-matrix is always available to other spaces. Perhaps 'visible state' would be better than 'active state', but the latter is the term used in the code for both alpha and beta versions.
active state 0 = 'Hidden'/'Off',[n6.7]
frame in sidebar is hidden, and nothing of this space shown in main area;
active state 1 = 'Visible',
frame in sidebar is yellow, and data-matrix of this space shown is in main area;
active state 2 = 'Active',
frame in sidebar is red, data-matrix and parameter sprites of this space shown in main area, and mouse interaction messages will be received for use with the sprites.
(6.2.4.c) sdf.sys.txt
Of the eight spaces in sdf.sys_alpha, space zero is reserved for the text editor, and is thus unlike the other seven spaces in several ways. In contrast to the three active states described above, there are just two active states for text editor in space zero:
0 =
sdf.sys.txt not active, nothing shown in main area, and interaction inputs are ignored.
1 =
sdf.sys.txt is active, text buffer is shown in main area, qwerty input is received, and mouse click in the main area will set cursor location in the text buffer.
Another way in which the sdf.sys_alpha space zero differs from the other seven spaces in the set of eight spaces is that, rather than having a float32 type data-matrix, multiple char type data-matrices are used by the 'sdf.sys.txt' sub-system.
The first matrix is the text-buffer and the char values stored in this are displayed as green-coloured text in the main area of the gl-ui. Second is a matrix that is used to display a single underscore glyph which, while blinking on and off, represents the sdf.sys.txt cursor location within the text-buffer; this matrix is rendered as red-coloured text in the main area. A third char type matrix, intended for use as indication of selected text, is not in use.
Figure 6.3 shows some of the many parts of the programming that contribute to the implementation of sdf.sys.txt in sdf.sys_alpha.
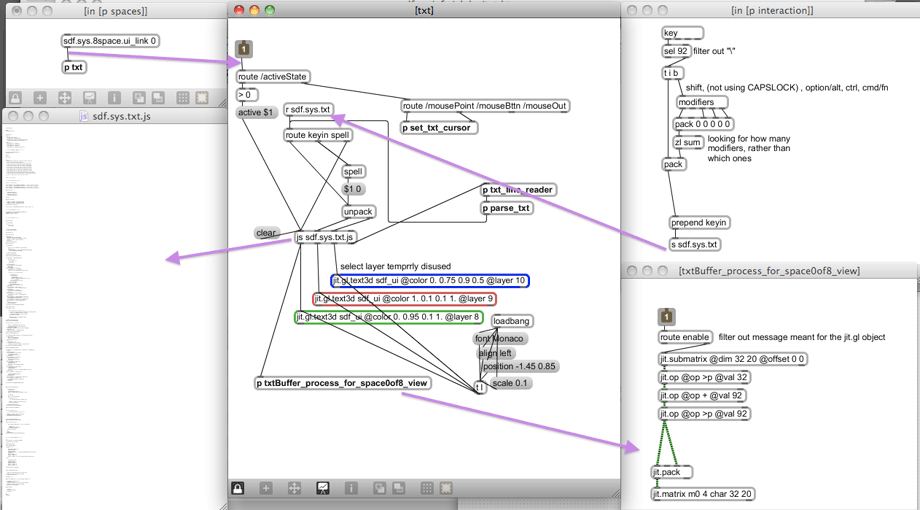
Figure 6.3: showing_part_of_sdf.sys.txt_alpha
The patch shown at the top-right of Figure 6.3 is an excerpt from the 'interaction' sub-patch, of sdf.sys_a51.maxpat. showing the initial processing of qwerty-keyboard input to the system. First, the “\” (backslash character) is filtered out because it is more trouble than that character is worth to process that as a string. Next, the modifiers object is triggered and the number of modifier keys being held during the key press is determined. That number is then packed into a list with the ASCII number of the key-press, and a 'keyin' message is formed as input to sdf.sys.txt.
The concept of a 'double-modifier' is used in sdfsys; abbreviated to [dblmod], the combination of [shift]+[alt] works on Mac OSX. Double-modifier key-presses are used as special inputs to sdfsys. For example, the key-combination [dblmod]+[backspace] is used to delete all characters in the text-buffer,1 and return the text cursor to the start of the first line.
In description of how the thisis drawing system came to be (§5.1), it was told that an external (to MaxMSP) text editor is used to write thisis syntax scripts in plain text files, and that when the text file being used is saved the thisis maxpat would be triggered to read each line of that file in sequence and parse the commands contained. That concept is brought into the alpha build of sdfsys in two ways:
The text-buffer of the internal (to sdfsys) editor is parsed when the key-combination [dblmod]+[enter] (or [dblmod]+[return]) is pressed; each line of the text-buffer is processed, one line at a time, and any valid sdfsys or thisis command is acted upon before the next line is read.
As well as bringing into sdf.sys_alpha the subroutines that comprise thisis syntax parsing and drawing, the abstraction that was used to read the external text files (txtFile.maxpat) is also connected within sdf.sys.txt; the following walkthrough gives an example of it being used via input to the text-buffer.
(6.2.4.d) A video walkthrough: commands and parameters in sdf.sys_alpha
Adopting a similar structure to that of sdfsys2min (Freeman, 2011), the following text, that accompanies a video walkthrough of sdf.sys_alpha, aims to give concrete examples of concepts already introduced. The video file is sdfsys9min2013alpha.mov which will be found in the sdf.sys_alpha_video_examples subfolder; the video was recorded with a live spoken commentary.
The first text command used in the video is to read from a pre-prepared text file that then sets the text-buffer with a number of other commands to initialise thisis within the environment:
txtfile read 2013exmpl.txt
Those initialising commands from that text file are then parsed (Figure 6.4), and some basic thisis drawing commands are demonstrated (Figure 6.5) before the 'polarpeek' module unit patch is loaded with:
setup space 2 load polarpeek
When that is parsed, and the module is loaded, the text-buffer is cleared and then set with a prompt:[n6.9]
[n6.9] If a text-buffer line is empty or begins with // or /! then it is ignored; text parsing is based first on the first symbol in the line, but, for thisis commands in particular, the syntax is thereafter slightly more complicated than a simple left to right hierarchy.
/! set matrix to read from: !/

space 2 m_peekfrom m?
By changing the '?' for '1', and parsing the text-buffer again, the 'polarpeek' module – which functions like a read-head-stylus of the gramophone model – is set to read from the thisis drawing data surface.
The polarpeek module that is loaded actually comprises two parts: a maxpat, and a .js with corresponding filenames. When the setup command is given for the module to be loaded into a space, both files are loaded. First the maxpat is loaded into a poly~ object; this patch contains a data-matrix-linked-DSP-algorithm with named parameters exposed via pattr objects and a pattrhub. The .js then acts as a bridge between those parameters and the gl-ui by creating a jit.gl.gridshape Jitter object for each: these are the sprites that are shown in the main area, and the .js that created them is also responsible for handling the mouse interaction with them.
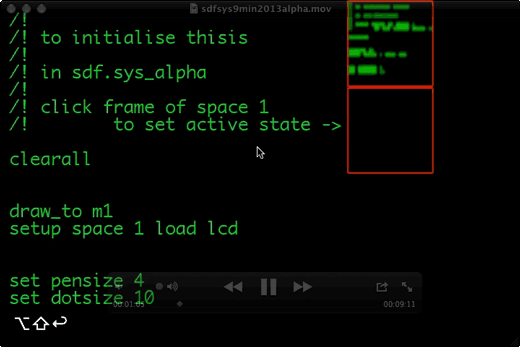
Figure 6.4: sdfsys9min2013a_1m5s
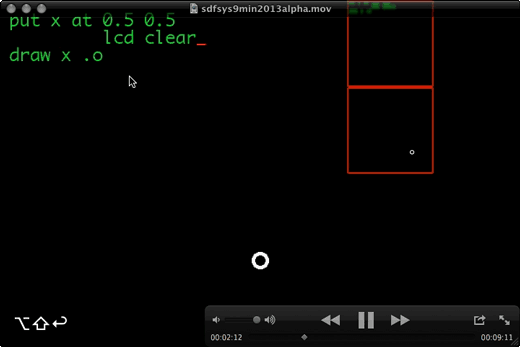
Figure 6.5: sdfsys9min2013a_2m12s
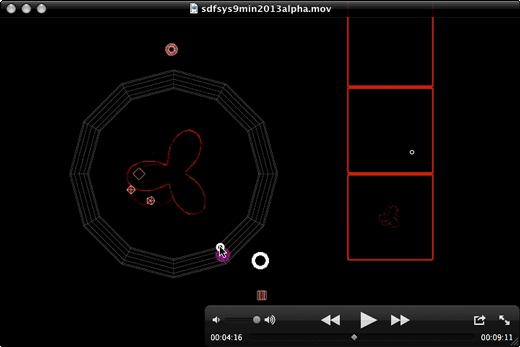
Figure 6.6: sdfsys9min2013a_4m16s
At the moment of the video that is shown in Figure 6.6, the mouse is being used to drag one of the frequency type parameter sprites. This type of sprite is always circular (technically, it is using the 'torus' shape of the gl-gridshape as its glyph), and the inner radius size of the frequency type sprite glyph is used to help visually differentiate between the different frequency parameters belonging to the same space. Whilst a frequency type sprite is being moved in the main area, an overlay 'guide' is made visible. This guide is also a torus in the jit.gl world, but it is configured to appear as a dodecagonal shape; the twelve radial lines manifest in this guide give visual orientation for equiangular divisions of the spiroid-frequency-space mapping that is used on the plane for these sprites.[n6.10]
[n6.10] The spiroid-frequency-space guide in the sdfsys_beta involves a thinner torus hoop and a spiral overlay, both still with dodecagonal corners though the spiroid mapping is not pitch-class quantised.
After a brief period of soundmaking with this configuration – polarpeek reading from the thisis drawn data – the module named tildegraph is loaded into space 3 (Figure 6.7), and then the command is entered to let polarpeek read from the data-matrix of that:
space 2 m_peekfrom m3
The algorithm implemented in this tildegraph module was originally saved under the name 'cycle writer' because it uses three cycle~ objects to write bipolar audio type values to the data-matrix cells. The output of two of the oscillators combine to control a path on the plane, and the third is used as the 'input' value for what is being written to the data-matrix.
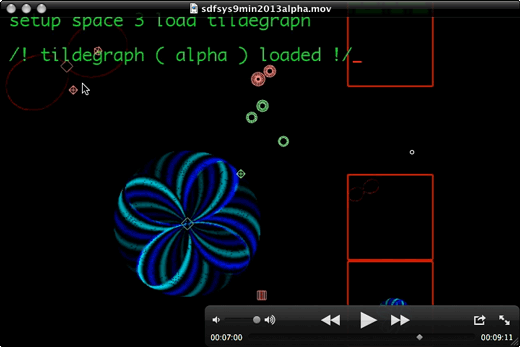
Figure 6.7: sdfsys9min2013a_7m
6.2.5 Soundmaking in context
(6.2.5.a) Colourisation: Looking at bipolar audio data-matrices on screen
With the tildegraph module writing audio data, and polarpeek reading that data in sdf.sys_alpha – as demonstrated in the final few minutes of sdfsys9min2013alpha.mov – the soundmaking software configuration is very similar to that of my conceptual model of a gramophone. One may recall – from §3.4.5 – that in the gramophone_002_a patch, only the positive values of the data surface were being visualised. That issue is resolved here by using blue and cyan for colourising bipolar data (see inset sub-patch in Figure 6.8).
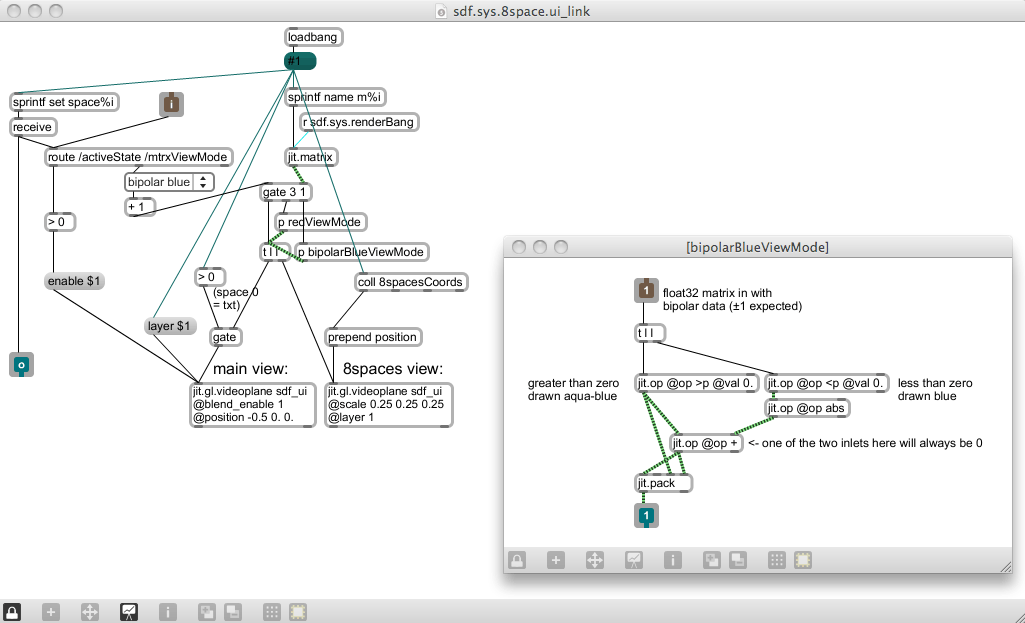
Figure 6.8: showing [p bipolarBlueViewMode] in sdf.sys.8spaces.ui_link.maxpat
(6.2.5.b) Tildegraph: from a module to a concept
The range of possible sounds that can be made in sdf.sys_alpha with polarpeek reading tildegraph is very broad, especially when one considers how simple the underlaying DSP actually is. One can go from harmonic organ-like tones to pitched and non-pitched noise by moving a parameter-sprite by just a few pixels on screen. I came to think of this soundmaking technique as 'tildegraphing', and so the word tildegraph was allowed to give name to a concept within the work, while the name of the audio data writing module in sdfsys was, for the beta version, reverted back towards it original name.
6.2.6 The tildegraph concept
(6.2.6.a) Seeing sound
I presented an overview of the tildegraph concept, in the context of sdfsys and this project, at the 2013 Seeing Sound symposium;[n6.11] a pdf version of my presentation is available online.[n6.12] Whereas the primary focus of that symposium is to do with 'visual music', I explained that I do not think of my work as fitting that genre: I am not making visual music, I am making music visually. In visual music the screened aspect is treated as an independent element of the whole, often used as counterpoint to the sonic part of a work.[n6.13] The direct relation of audio and visual data through the tildegraph concept in sdfsys seeks to establish an altogether different experience. The system has been conceived as a working environment for composing, and while audience observation is expected, that expectation arises from the context of live coding praxis. The abstract patterns that are typical of sdfsys tildegraphing, although independently stimulating in the visual domain, are controlled as an integral part of the soundmaking process, rather being a counterpoint or complement to it.
[n6.11] 23–24 November 2013, Bath Sap University; http://www.seeingsound.co.uk/seeing-sound-2013/2013-papers/
[n6.12] http://www.sdfsys.info/blog/wp-content/uploads/2013/11/seeingsound2013_tildegraph_in_sdfsys.pdf
[n6.13] cf. Papers from the 2011 Seeing Sound symposium: http://www.seeingsound.co.uk/programme-2/papers/
The animated visual works of John and James Whitney featured as a prominent theme in the 2013 Seeing Sound symposium programme, and there is strong visual link between much of that work and the visual character of my tildegraphing modules. Their 1944 Film Exercises used a 'subsonic sound instrument [that] consisted of a series of pendulums linked mechanically to an optical' system which was 'was synthetically exposed onto film' (Stamp, 2013).[n6.14] This has obvious connection to the earlier described harmonograph. Later Whitney works were made with adapted analogue computer, and then early digital computer technologies; Zabet Patterson, for example, provide discussion of the Whitney brothers' use of these in an aesthetic context (Patterson, 2009).
[n6.14] Richard Stamp (2013) cites: (John Whitney, �Moving Pictures and Electronic Music�, 1959)
(6.2.6.b) The tildegraph concept in the context of wave terrain synthesis
To contextualise this soundmaking technique the wave terrain (WT) method of synthesis is cited (Roads, 1996, pp. 163–164):
Several computer music researchers, including [Bischoff, Gold, and Horton (1978)], Mitsuhashi (1982c), and Borgonovo and Haus (1984, 1986), have explored the possibilities of techniques that scan a wave terrain using two indexes.[n6.15], [n6.16], [n6.17], [n6.18]
[n6.15] Bischoff, J., R. Gold, and J. Horton. 1978. “A microcomputer-based network for live performance.” Computer Music Journal 2(3): 24 29. Revised and updated version in C. Roads and J. Strawn, eds. 1985. Foundations of Computer Music. Cambridge, Massachusetts: The MIT Press.
[n6.16] Mitsuhashi, Y. 1982c. “Audio signal synthesis by functions of two variables.” Journal of the Audio Engineering Society 30(10): 701 706.
[n6.17] Borgonovo, A., and G. Haus. 1984. “Musical sound synthesis by means of two-variable functions: experimental criteria and results.” In D. Wessel, ed. Proceedings of the 1984 International Computer Music Conference. San Francisco: International Computer Music Association. pp. 35 42.
[n6.18] Borgonovo, A., and G. Haus. 1986. “Sound synthesis by means of two-variable functions: experimental criteria and results.” Computer Music Journal 10(4): 57 71.
The traditional conceptualisation of a wave terrain is as a three-dimensional surface in which (ibid., p.164):
the z-point or height of the surface at each point represents a waveform value for a given pair (x,y). The waveform stored in such a table is a function of two variables, and the technique has also been called two-variable function synthesis (Borgonovo and Haus, 1986).
A scan over the terrain is called an orbit. Although the astronomical term "orbit" connotes an elliptical function, the orbit can consist of any sequence of points on the wave terrain.
The read-head-stylus type module of the tildegraph concept in sdfsys (such as the polarpeek module described) is analogous to the WT orbit, but there is a significant difference to be noted. The WT orbit is described as remaining always within the dimensional bounds of the WT: it is said that 'the orbit skips from one edge of the wave terrain to another edge' which is the same as 'the right-to-left wraparound that occurs in one-index wavetable scanning' (ibid., p.164–165). The cycle~ object in MaxMSP implements a one-index wavetable that can be scanned by signal value input to its right inlet. An input value of 0 is (mentally) visualised as the left edge, and 1 as the right. If the input is greater than 1, then wraparound will occur such that, for example, an input of 1.2 gives the same output as does an input of 0.2. In the implementation of my conceptual model of a gramophone (§3.4), a Jitter matrix is used as a two-index wavetable with the jit.peek~ object facilitating access to that matrix data which is (actually) visualised with left, top, right and bottom edges on screen. In the soundmaking experiments that were based on that implementation I found creative use of the non-wraparound behaviour exhibited by the jit.peek~ object: any input to the dimensional index inputs of jit.peek~ that is beyond an edge of the wavetable-matrix gives an output value of zero. This behaviour is the basis for the controlled inclusion of silent periods within the audio output of the g005g composition (§3.5), and the tildegraph concept inherits directly from that work.
In description of WT synthesis, Roads continues to address the 'problem of generating predictable waveforms' with the technique (p.164):
systematic investigations of the technique have focused on wave terrains generated by relatively simple mathematical functions. […] the advantage of using simple mathematical functions is that it is possible to predict exactly the output waveform and spectrum generated by a given wave terrain.
My work has been shown to favour simple mathematical functions, but exact prediction of the output is not my motivation for that. With the tildegraph concept I am interested in controlling sound – that is to say in generating an output waveform and spectrum – by manipulating the parameters of multiple interacting spatiotemporal processes. These processes are comprehensible both in terms of their visual manifestation[n6.19] and in terms of how those processes, and the interaction between multiple processes, are manifest in sound. It just so happens that (aesthetically) pleasing patterns can be created, in both the visual and audio domains, from the (technical) implementation of simple mathematical functions. My investigation is focused these such factors.
[n6.19] One has control (either directly or indirectly) over visual attributes such as radius, rate of rotation, and shape.
The audio output possibilities of orbits on a two-variable function wave terrain were studied by Borgonovo and Haus as a specific case of a more general idea (1986, p. 57) :
The basic idea of the technique is that we can obtain an audio signal by the sampling of an n-variable function along an orbit determined by n expressions of time-dependent variables.
Samples can be directly calculated or read by means of n dimensional table lookup.
[…] We have not considered n > 2 cases because they need too much memory.
The decision of these authors to study a two-dimensional structure is, thus, attributed to the technical factor of what their computer[n6.20] was able to handle. On the 'continuous spectrum that connects aesthetics to technics' (Gilbert Simondon, 2012), it would appear to me that researchers such as Borgonovo and Haus are focused more toward the technics. My own work, however, is more focused on the aesthetic part of the techno-aesthetic.
[n6.20] Borgonovo and Haus (1986) 'implemented the technique on a digital signal processor (a Digital Music Systems DMX-1000) for real-time synthesis and on a Fairlight CMI Series IIX (controlled via a DEC VAX-11/750) for interactive experimentation and composition.'
My decision to work with a two-dimensional method that is similar to WT synthesis is derived from the fact that screens are flat (that is to say, two-dimensional), and that I am exploring visual representation of sound in software, and on screen. It is a technical observation that screens are flat; it is an aesthetic motivation that directs my practice to hold that as important.
The tildegraph concept is not restricted to the use of WT-like function-filled data-matrices. The cycle-writing module that first carried the tildegraph name can, indeed, be thought of as being based on a simple mathematical formula with time-dependent variables (and thus very WT-like). The first example of the orbit-like polarpeek module generating sound in sdfsys, however, was with data being read from the matrix being drawn to via thisis commands. Thisis permits geometrical drawing, and geometrical thinking has been a part of human culture for much longer than has the algebraic conception of number (Barrow, 1993; Hart, 2012) through which data writing functions are expressed.
(6.2.6.c) Wave terrain and scanned synthesis
During the period of this research I have noticed a number of projects based on the 'scanned synthesis' method of soundmaking.[n6.21] Of these, research by Robert Tubb has also made reference to WT synthesis; Tubb's 'Investigation into Scanned Synthesis and Multi-Touch' (2011) cites the WT technique as closely related that of scanned synthesis, pointing out (p.14) that Roads' discussion of WT synthesis 'pre-dates the first paper on scanned synthesis by a number of years when he says':
[n6.21] Described by Bill Verplank, Max Mathews and Rob Shaw (2001)
One can also imagine an extension where the orbit is fixed but the wave terrain is time-varying. In this case the wave-scanning process is equivalent to tracing the curves of an undulating surface, like wave motions on the surface of the sea. (Roads, 1996, p. 166)
Another contemporaneous work to employ scanned synthesis is the 'Tüb – Interactive Sonification of Water Waves' (Erlach et al., 2011). This is a system that uses a Cymatic-like configuration of a circular body of water over which specific lighting and a camera are positioned; human interaction with the water creates wave patterns, and DSP based on the camera images of these then generates sound.
6.2.7 Concluding the alpha build
The flow-chart in Figure 6.9 illustrates, at a relatively high level of abstraction, how sdf.sys_alpha is structured. Having arrived at this stage in the development of sdfsys, programming stopped, and attention was turned to questioning what was working well, and what could be made better. The alpha build, as its naming suggests, was always going to be a testbed for the ideas contained within it. Certain problems within sdf.sys_alpha – such as those leading to all but three of the eight spaces module slots being removed – were addressed by the process of redesigning various aspects of the environment.
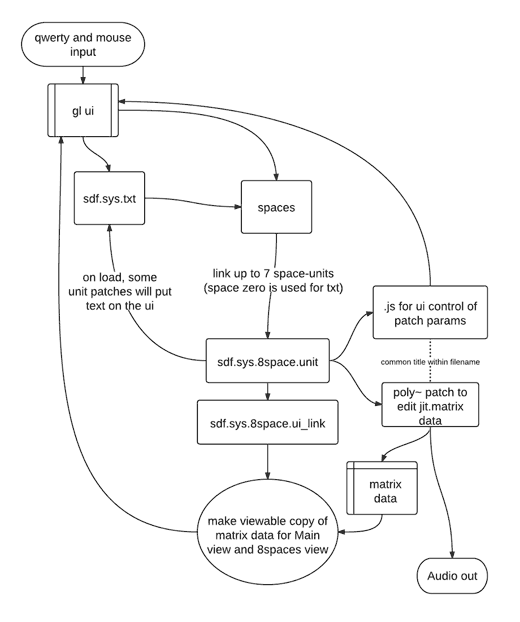
Figure 6.9: SdfSysAlphaStructure