4.2 Some similar spirals
4.2.1 In the inner ear
Connecting the acoustic (§2.1) and the psychoacoustic (§2.2) there is a physiological layer in the process of human perception, and connecting the ossicles of the middle-ear to auditory nerve and the brain is the cochlea. To liken the spiroid to the cochlea is more than conjecture: writing in Trends in Medical Research, Kang Cheng et al. (2008) describe how angles are equated to frequencies in a cochleaogram. A cochleaogram is visual representation of the cochlea that is used, for example, by the makers of cochlea implants. The model proposed by Cheng et al. describes a spiral mapping of frequencies that is very similar to that of the spiroid. (Cheng et al., 2008, p. 37 [sic]):
In this investigation, we originally propose a mathematical model of a logarithmic spiral function with a base 2, in a polar coordinates system, to plot a cochleaogram that covers the whole human auditory range, based on Ohm's 2nd (acoustical) law and published data. Our model mathematical predicts how a cochlea decodes sound information from a frequency domain to a spiral spatial domain. […] We believe our model is more meaningful and more useful than the previous to hearing-impaired patients and audiology, as well as music therapy and music theory.
[n4.9] https://wiki.engr.illinois.edu/download/attachments/49746529/TEAM1S11_Fig9.jpg (Accessed 20130326)
Elsewhere, Ariel Moctezuma – in (Moctezuma, 2011, p. 9)[n4.9] – 'shows the frequency-spatial arrangement of audio peak responses in the human cochlea' using a spiral form, but without the use of spiroid-like polar coordinates to align octaves to polar coordinate angles. In both of these cochleaogram examples, the lower frequency values are represented in the centre of the spiral, and this matches the original specification of the spiroid-frequency-space, as expressed in the equations above and also as manifest in my first generation of software implementations (described in §4.3).
4.2.2 In print
In my more recent work the inverse radial mapping of the octave-level attribute is used in the spiroid, so that it is higher frequencies that are found toward the centre of the representation, and this is the mapping that was described in Spiral audio spectrum display system (US patent) by Allen G. Storaasli (1992). The system described by Storaasli, however, did not employ the Archimedean spiral (see Figure 4.7, below), nor the use of midi-pitch to theta transformations, and was described only as a spectrum analysis display whereas the spiroid is also conceived as an interface for frequency value input to software systems. Notwithstanding those significant differences, important remarks which are relevant to the aesthetic motivation of this project are found in the 'Description of the Related Art' section of that document (Storaasli, 1992, p. 1):
Spectrum analyzers sample time-varying signals and display the energy content in x - y format […] One with a well trained eye might be able to identify certain patterns in a static signal or single frames of a dynamic signal, especially those involving large peaks and valleys. However, it is extremely difficult for the average viewer to recognize pitch and harmonic content in most audio signals, particularly dynamic signals.
Storaasli describes that the aim of displaying values of a spectral analysis with octave-alignment on a spiral is to 'facilitate the recognition of pitch and harmonic content' of an audio signal in the visual domain (ibid.); my own developments of the spiroid have confirmed the utility of such spirals in this regard, and it transpires that I have not been alone in pursuing this principle during recent years (see §4.2.3).
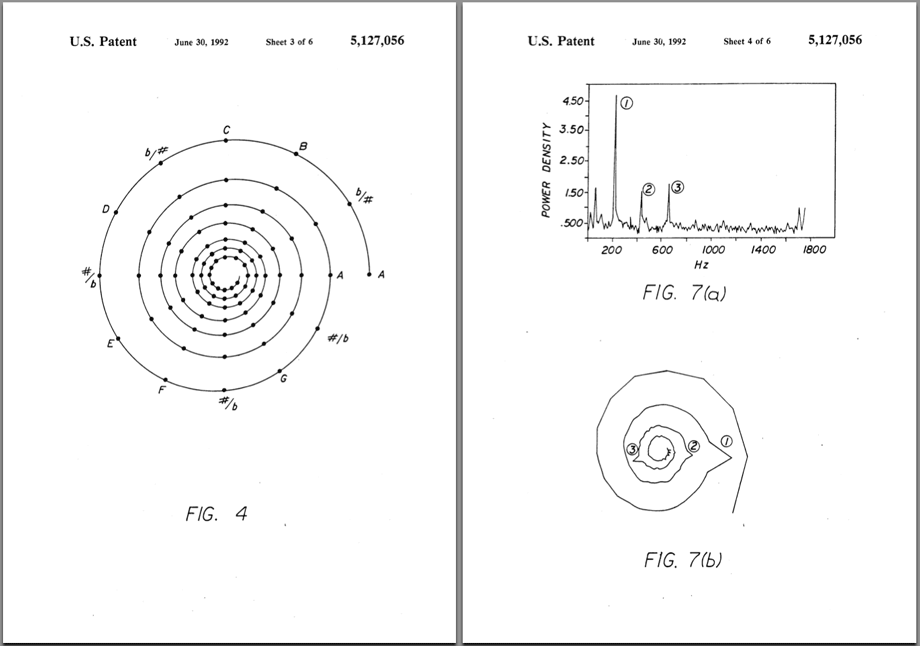
Figure 4.7: Storaasli Pat.5127056
Representation of 'chromatic pitch space' in Musimathics volume 1 (Loy, 2006, fig. 6.6, p.165) is another example to place lower frequencies at the outer of the spiral illustration (this cited example is included here as Figure 4.8 below), and – also in common with the Storaasli system – has pitch ascending in an anti-clockwise direction. Loy places the pitch-class 'C' at the three o'clock position, which is also something that I later adopted in my practice.
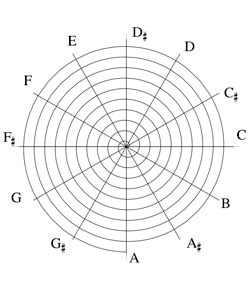
Figure 4.8: chromatic pitch space
It is often in connection to comparative descriptions of various tuning systems that diagrams similar to the spiroid are published. The visual form of a spiroid-like structure is typically employed to illustrate the 'near miss' of the octave alignment after an accumulation of true harmonic ratio intervals; in Figure 4.9, for example, the difference is shown – in the larger, centred spiral – between the frequency that is arrived at after twelve consecutive perfect fifths and the true octave equivalence of a frequency that is transposed up seven octaves from a starting angle at twelve o'clock (Ashton, 2003, p. 40; illustration from p. 41):
This is because (3/2)12 ≈ 129.75, whereas (2)7 = 128. The difference is known as the Pythagorean comma [which as a ratio is] approximately 74:73.
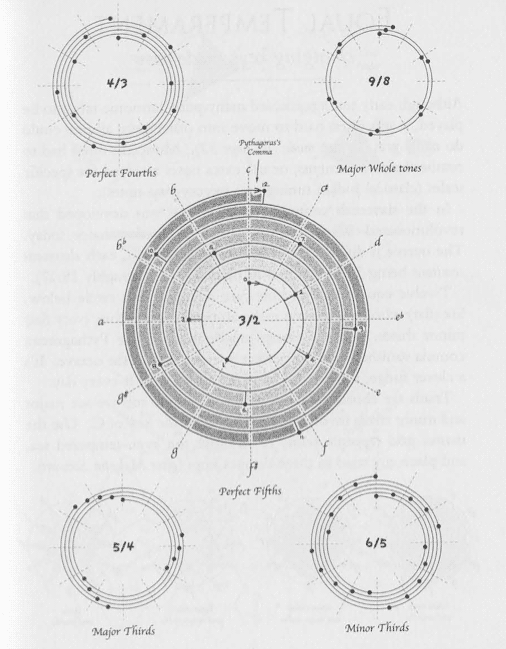
Figure 4.9: Showing the progression of different intervals
Figure 4.9 shows the illustrations of five different ratio interval progressions on pitch-class-circle spirals that accompany Ashton's text. Lower pitches are drawn toward the centre of these spirals, and pitch ascends with clockwise rotation, which is the same as in the original spiroid specification. Printed examples such as these from Ashton – to give another, Benson has similar (2007, p. 5.4, p. 165) – aim to elucidate the discrepancy that exists between 12TET and the natural harmonics of musical sound; information that, for me, although intellectually assimilated, only became experientially appreciated after working with real-time interactive software implementations of the spiroid-frequency-space as a spectrum analysis display.
4.2.3 Photosounder Spiral
In the first week of August 2013, Computer Music magazine cryptically announced a new plugin to be bundled with the software supplement to the then forthcoming edition of their publication (Computer Music, 2013):
Our next CM Plugin, Spiral CM by @Photosounder! What d'ya reckon it's for? It's out next week, free with CM195. pic.twitter.com/oZBOQRGGeB
The image that is linked to at the end of that tweet is included here as Figure 4.10 below. It clearly shows a spectrum analysis of a sound in which a 'C major' chord is being played, and my first intuition – based on experience with my own spiroid analysis displays – was that the sounds there pictured were from synthesised sawtooth waveforms; experimentation with the Spiral CM plugin appears to confirm that reading of this screenshot.
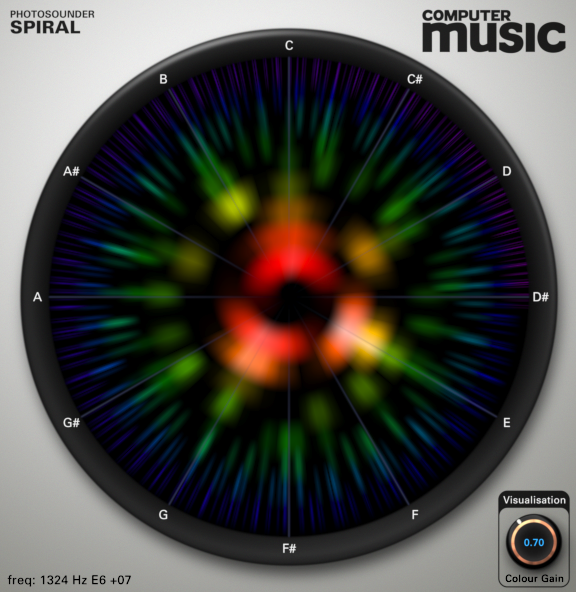
Figure 4.10: Photosounder Spiral CM
The Spiral CM version of this software by Photosounder – which can be obtained by purchase of Computer Music magazine issue 195 or later – has just one parameter to adjust the 'colour gain' of the visualisation. A version, simply called Spiral, with many more controllable parameters is commercially available through the product's web site[n4.10] where Michel Rouzic writes (Rouzic, 2013):
[n4.10] Specifically via http://photosounder.com/spiral/download.php (accessed 20130916)
I originally created Spiral in September 2012 both to have something similar to SplineEQ's analyser with the ability to provide relevant musical information and to teach myself music by instantaneously analysing the notes of whatever music I would listen to. It turned out to be very efficient and I was able to quickly analyse and memorise musical pieces of varying length and complexity. […] I also use it to tune my guitar quite fast and very precisely […] and in general to understand the composition, spectral makeup of various instruments, mastering and stereo mixing of the music I listen to
Through use of my own software versions of the spiroid-frequency-space as a real-time analysis display – dating originally to autumn 2008, and described in §4.3 below – I have found, too, that instantaneous identification of pitch content in real-time audio, and precision tuning for instruments (particularly guitar) are notable benefits that are brought by this type of view into the frequency-domain of sound. In the context of live improvisation within an ensemble, for example, a spiroid display can act as a prosthetic sense of 'perfect pitch' enabling the dominant pitch-classes of the audio input to be effortlessly followed by eye.
The Photosounder implementation of the spiroid-frequency-space concept is visualising a fast Fourier transform (FFT) analysis, and this is the method that was described by Storaasli except that the Spiral CM and Spiral displays have their lower frequencies closer to the centre of the encircled display which is more like the spiroid initially described in §4.1 above. The linear mathematics of FFT analyses determine that, in terms of pitch-class resolution, there is much more precision at the upper octaves of the frequency spectrum, and this is manifest in the Photosounder plugins by the larger angles of arc that are used toward the centre of the display.
As the start of a series that will be ongoing beyond this project, I have made two videos that demonstrate how the spectra of sinusoidal, triangle, sawtooth, and square shape waveform oscillators manifest in Photosounder Spiral CM plugin, and explore some of the observations that can be made such experiments (Freeman, 2013).[n4.11] The patches used in those two videos are included in the Photosounder folder in the chapter4 directory of the portfolio.
[n4.11] Videos published under the name of Experimental Music Technology.