4.5 Assessment of the spiroid
This chapter has introduced and contextualised the concept of a spiroid-frequency-space for the representation of frequency values on the plane. The use of a polar-coordinate-type mapping to align octave-equivalence creates an intuitively understandable representation of the frequency-domain.
4.5.1 Recapitulation
When the spiroid is employed as a display for analysis data – as in my spiroidArc implementations (§4.3 and §4.4.3), and in SPIRAL by Photosounder (§4.2.3) – the view is akin to that of an oscilloscope, only of the frequency- rather than time-domain. I am also inclined to suggest simile of this display to Cymatics, but whereas Cymatic figures give some indication of harmonic resonance within the physical system used, the abstracted mathematical system used by the spiroid gives an impression of the harmonic structure within the sound signal input.
Examples for spiroid-based interfaces that I have designed for human input to software have been described. Both the nRadii example (§4.4.1) and the example of frequency markers (§4.4.3) are based on the specification of a value as a point on the plane; the mapping of a cartesian point on the screen may, or may not, take into account quantisation to given pitch-class angles or octave-levels. This spiroid-on-the-plane method for inputting values has the advantage of being compatible with the visual output of frequency analysis within the same area of the computer screen. It is also advantageous that this method is able to simultaneously represent many values upon the same spiroid mapping. A spiroid-frequency-space mapping is one of several spatial mappings used for setting parameter-values in the main area of the sdfsys environment interface (§6).
For situations in which a large area of screen is not available for representation with a spiroid mapping, the spiroidial has been designed (§4.4.2). In that design, a 'local' spiroid mapping is defined at the centre of each dial-like widget; the angle of the 'needle' on, and the radius of that dial. While the spiroidial has been introduced in this chapter, its use is described as part of CirSeq Zero in the following chapter.
4.5.2 Spiroid beyond this project
This chapter has shown that the general concept of what I call a spiroid-frequency-space is a long established form of visual representation; in addition to the Drobisch type of helix described and extended by Shepard (see §2.2.2), the pitch and frequency-domain aspects of sound are often represented two-dimensionally with a spiralling form.
There are many routes by which one may arrive at a concept the same as, or very similar to the spiroid. For me it was discovered after a compositional process involving hand drawn representations of pitch-classes, followed by scales of notes, and then continua, and since I began development of the spiroid (c. 2005), it has been a matter of some perplexity that this archetypical visual representation is not commonly found in computer music software. During the period of this project, however, there have been new software releases found to have spiroid-like interface elements, and I hope to see many more in the future.
The most recently found example of new software that would appear to be using a spiroid-based mapping was presented at the 'IRCAM Forum Workshop 2013' (November 22); it has not yet been released, but is described in abstract for that event (Picasso & Hélie, 2013):
Presentation of SNAIL iOS App
The SnailAnalyser is a frequency domain sound analyser with an original chromatically aligned representation. Compared to standard analysers, this representation allows simple visualization of active zones in a sound (similar to a spectrum) and organises frequencies per notes on a tempered scale like a tuner.
At the time of writing, further details of this project were scarce; the authors, however, have kindly directed me to one document that is public, and which gives 'the basic idea and a basic result with a picture' (Figure 4.26).[n4.21] They state 'that the "true" application gives "better results"', but that they 'cannot give you any detailed information before (probably) June' (H?lie & Picasso, 2013).
[n4.21] Online at http://recherche.ircam.fr/anasyn/helie/hdr/HdR_ThomasHelie_v1.5.pdf (see page 90 → pdf page 102)
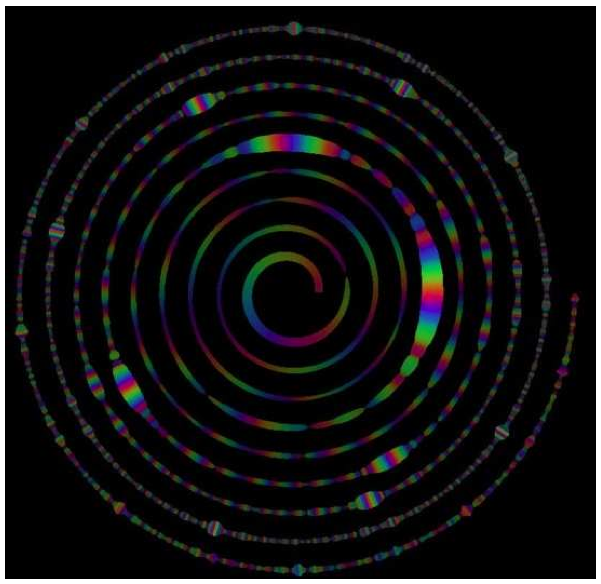
Figure 4.26: SnailAnalyzer
With software products such SPIRAL by Photosounder, and the SnailAnalyser becoming available, there is likely to be an increase of interest in the subject of spiroid-like representations. It remains to be seen whether or not the term spiroid will catch on in relation to the concept; I have registered the spiroid.info web domain towards collating information on spiroid related things, both historical and contemporary.
4.5.3 Chapter conclusion
Spiroid-based systems could be utilised in pedagogy, entertainment, and scientific research situations, as well as in the arts. Within this project the spiroid-frequency-space concept has techno-aesthetic significance. It is the basis of practical methods for interface design, being the default mapping assumed for the visual representation of frequency-values. It embodies key aspects of human perception, both in the auditory-domain (octave-equivalence of pitch-class), and in the visual-domain (evoking form constants originating in the visual cortex; see §3.4.2). It embraces non-rectilinearity with a Cymatic-like atemporality bringing focussed attention to the experience of now when working with sound in computer music software.